How can I Differentiate Between Discrete and Continuous Probability Distributions
Question
A probability distribution is a formula or a table used to assign probabilities to each possible value of a random variable X. A probability distribution may be either discrete or continuous. A discrete distribution means that X can assume one of a countable (usually finite) number of values, while a continuous distribution means that X can assume one of an infinite (uncountable) number of different values.
Discrete probability distributions
Several specialized discrete probability distributions are useful for specific applications. For business applications, three frequently used discrete distributions are:
-
Binomial
-
Geometric
-
Poisson
You use the binomial distribution to compute probabilities for a process where only one of two possible outcomes may occur on each trial. The geometric distribution is related to the binomial distribution; you use the geometric distribution to determine the probability that a specified number of trials will take place before the first success occurs. You can use the Poisson distribution to measure the probability that a given number of events will occur during a given time frame.
Continuous probability distributions
Many continuous distributions may be used for business applications; two of the most widely used are:
-
Uniform
-
Normal
The uniform distribution is useful because it represents variables that are evenly distributed over a given interval. For example, if the length of time until the next defective part arrives on an assembly line is equally likely to be any value between one and ten minutes, then you may use the uniform distribution to compute probabilities for the time until the next defective part arrives.
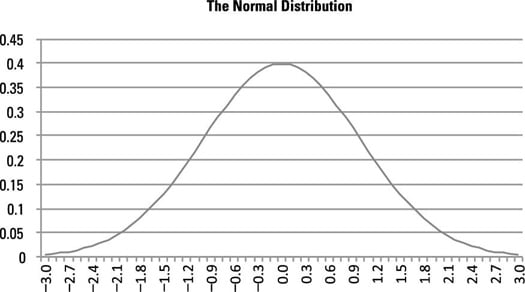
The bell-shaped curve of the normal distribution.
The normal distribution is useful for a wide array of applications in many disciplines. In business applications, variables such as stock returns are often assumed to follow the normal distribution. The normal distribution is characterized by a bell-shaped curve, and areas under this curve represent probabilities. The bell-shaped curve is shown here.
CREDIT:
By Alan Anderson
www.dummies.com/education/math/business-statistics/differentiate-between-discrete-and-continuous-probability-distributions
Leave an answer
You must login or register to add a new answer.