Can You Make An Infographic In Powerpoint
Question

An infographic is a set of images, diagrams, and minimal text that gives a simple and clear overview of a topic.
They can improve cognition by using graphics to enhance a person’s visual system’s ability to see patterns and trends.
Can these be done with powerpoint? Yes of course.
An infographic in powerpoint is just the presentation of data and graphics on a particular topic, templates from powerpoint are well suited for an infographic of any kind.
How to Make Infographics with Powerpoint
With “infographics” many look at “PowerPoint” as the unlikely. In fact, many people are completely unaware that you can create great infographics with PowerPoint.
In the meantime, it’s an incredibly useful tool that comes with fully customizable options and no cost because most people have this program.
There’s no need to purchase (or learn!) Photoshop or subscribe to any infographic creation software, which tend to have a high price tag.
Many content creators avoid infographics for this very reason: It takes a lot of time, effort and money to create them.
Another option is to outsource infographics to professionals to do everything for you.
But if you’re looking for a great do-it-yourself option, PowerPoint offers an amazing and very effective option that allows you to create high-quality, original infographics to complement your content marketing strategy.
Creating infographics in PowerPoint is amazingly easy. The sole limitation is your patience and imagination.
Even the more complicated techniques are simple, and there are many ready-made and easily customizable elements to get you started. We’ve put together a very simple eight-step guide to creating infographics using PowerPoint.
Before we get started, please note that exactly how you will change the settings and use certain controls may vary slightly depending on your version of PowerPoint.
Step 1: Create A Portrait Slide
Start with a blank presentation and a new slide. By default, PowerPoint uses landscape slides. You will need to change this. Go to the Design tab and click Slide Size and then Custom Slide Size. This will bring up a dialog box. Change the slide orientation to Portrait and add the custom dimensions:
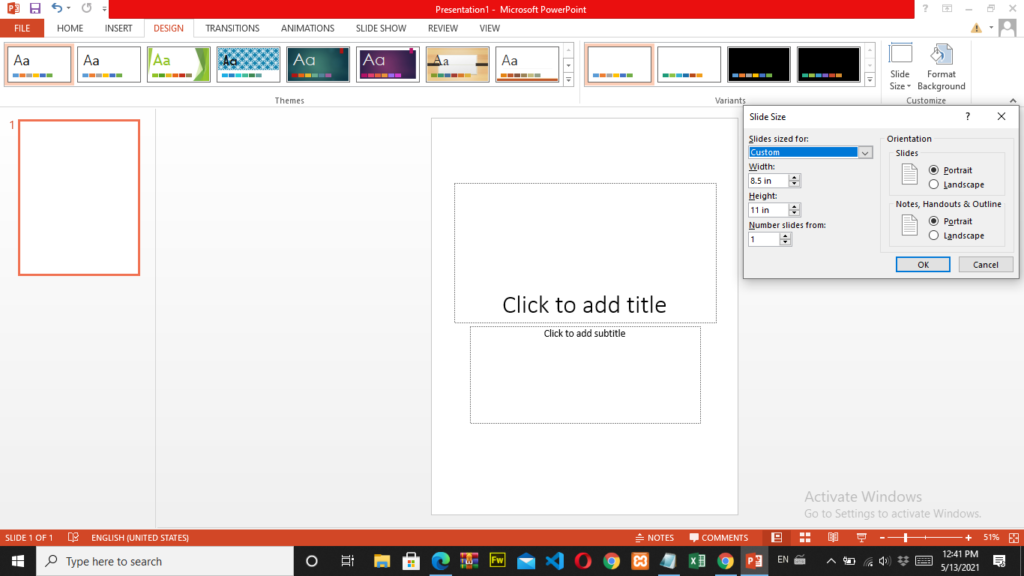
To start, it is recommended that you make your image 6 inches wide by 14 inches high. Remember, however, that different platforms have different size requirements, so consider where you want to place your infographic when choosing a size.
Step 2: Format the background for the infographic
Give your infographic an interesting background. There are several ways to do this. The easiest way is to choose an attractive theme in the Design tab, which allows PowerPoint to set the background and additional colors for you:

Step 3: Editing the heading and subheading
By default, the slide will have a standard format that includes the heading and subheading elements.
You can edit the text of each of these and move them to the desired area of the infographic. Placing them at the top is usually a good idea, but you can play around with the design and see what looks best:

Step 4: Adding New Elements with SmartArt
Before we move on to more advanced features, let’s look at using SmartArt to insert responsive elements.
There are many ways to add custom shapes, diagrams, and vector graphics when creating infographics in PowerPoint.
However, the SmartArt application provides an easy way to add a wide variety of elements that look awesome and require no effort when creating:

Go to the insert tab and select “SmartArt”; then choose the type of element you would like to include. You can play around and have fun, as there are many options. It’s fully possible to create everything else needed for a truly dynamic infographic using nothing but SmartArt. Pick one to start with and click “OK”:
Click on your graphics to edit the text elements and add your original content.
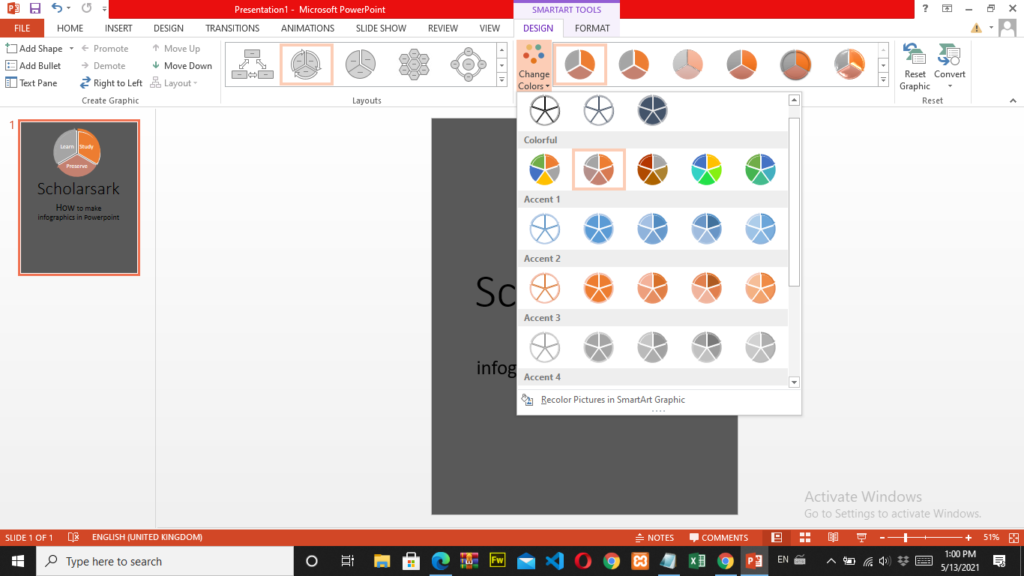
Lastly, select the color you want to use from the “Change Color” option. If you choose a theme when you select the background, all your elements will have default colors. Otherwise, you’ll have to select them manually, and you can change the colors even when using the theme.
Step 5: Create unique elements with shapes and text boxes
Although SmartArt’s capabilities are quite extensive, you may find that there are some elements that you want to create for which there are no suitable preset options.
You can do this by combining shapes with text boxes, creating completely unique elements for your infographics. Click the Insert tab and choose Shapes. Then choose from the wide range of shapes available:

After inserting the shape, use the options that appear at the top to choose a color. You can use one of the preset options or use the Shape Fill and Shape Outline options to choose custom colors. You can also use the Shape Effects feature to make the shape more dynamic:
Once your shape looks the way you want, add a text box by going to the “Insert” tab and choosing “Text Box. You can add multiple text boxes, adjust the fonts, sizes, and colors, and then move them around to position them as you want over the shape:
When you’re happy with how all your text boxes and shapes appear together, select all the parts of the new element you created, including the form and all the text boxes, by clicking each of them in turn while holding down shift (the control may be slightly different, depending on the computer or device you’re using).
In the end, you should have all aspects of your unique element selected. When you are sure that you have selected all aspects, right-click on the selected items; then click “Group” and select “Group” again.
Step 6: Add original images to create complex elements
Another great way to make infographics completely unique to your brand is to add original images. You can use photos (especially if you have brand photos) or choose relevant icons or graphics.
Whatever you use, it’s a good idea to add images to the elements to make the infographic as visual and engaging as possible. You can do this in two ways:
You can use the Insert tab to add images as you added the shapes and text boxes, and combine the images with them just as we used in step 5.
However, a simpler way is to use SmartArt elements that include images. Go back to SmartArt and insert a new element that includes images; edit it as we did in step 4; and then click on any of the empty image icons:
A dialog box appears with various options for selecting an image source. Find the file you want to use and paste it. Repeat this as many times as necessary to replace all blank images with custom images. This will help you create dynamic elements for your infographic.
Step 7: Optimize the layout of all the elements
Keep adding elements to your infographic until it has all the information you need and everything is formatted to your liking in terms of images, fonts, and colors.
Once you’ve placed all the elements on the infographic, play around with the layout until everything is presented in the most logical and visually pleasing way.
You may find that some elements inserted with SmartArt work better if you move them around in different aspects. This is useful for making them more unique, as well as for fitting elements together:
Remember, one of the benefits of creating infographics in PowerPoint is that you can always go back to “Custom Slide Size” in the Design tab to resize your infographic if you find that you have too much or too little space.
Step 8: Save your infographic
When you’re happy with your infographic, go to File, click Save As, and choose the type of file you want to save the infographic in.
By default, PowerPoint will save it as a presentation, but you can choose different file types from the drop-down list.
You can publish your infographic as a PDF, but your file will be more versatile in JPG or PNG format. There’s no reason you can’t save it in multiple formats so that you have different versions for platforms with different requirements.
When you click “Save,” PowerPoint will ask if you want to save the entire presentation or just one slide. Select the slide.
The end result is an image file that looks great and can be uploaded anywhere:
Leave an answer
You must login or register to add a new answer.